One of the most powerful tools in Google Analytics is the ability to create segments. Segments enable you to quickly and easily combine different groups of visitors then see how those visitors interact with your site versus everyone else.
One of my favorite ways to use segments is in measuring how people coming from organic Google searches view the site, buy, and build loyalty by repeatedly visiting the site.
Having this segment also helps you to know whether Google’s algorithm changes are causing increases/decreases in your site traffic, or if those changes are caused by something else.
Read on for step-by-step instructions on how to set up this particular segment and how to use it in analyzing your site!
As we all know, Google constantly makes changes to its algorithm, which can cause significant changes in your traffic.
But Google’s not the only traffic source that frequently changes!
Here’s a simple solution that enables you to see traffic coming from Google Organic Search (which doesn’t include paid Google AdWords traffic) to your site, so you can quickly get lots of different answers about your google search-based traffic versus all the other traffic to your site.
There are lots of ways to get at this data, but I’ve found great value in creating a Segment in Google Analytics, enabling me to use it in many different reports to get quick and easy answers that aren’t available otherwise.
And best of all, once you create a generic segment like the one we’ll create today, you can use that segment to report on Google search traffic on all of your different sites, so this is a high-leveraged “work once / profit for years” project that will take you about 3 minutes to complete!
Step 1: Create A Google / Organic Traffic Segment
Log into your Google Analytics and choose any of your sites (preferably one that gets lots of natural search traffic)
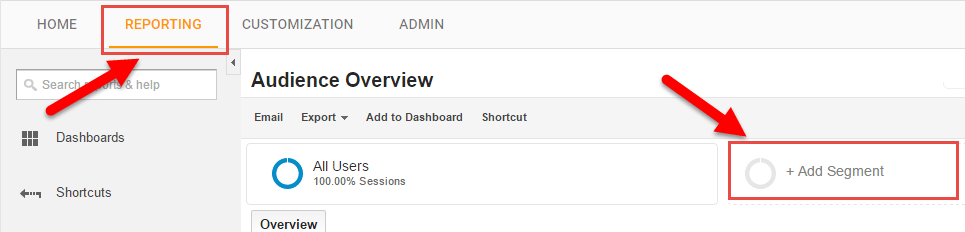
Click the reporting tab, then on any page, click the + Add Segment box
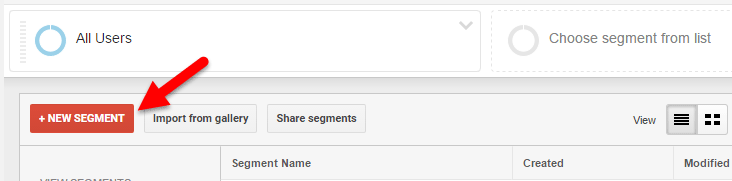
On the next page click the + NEW SEGMENT button
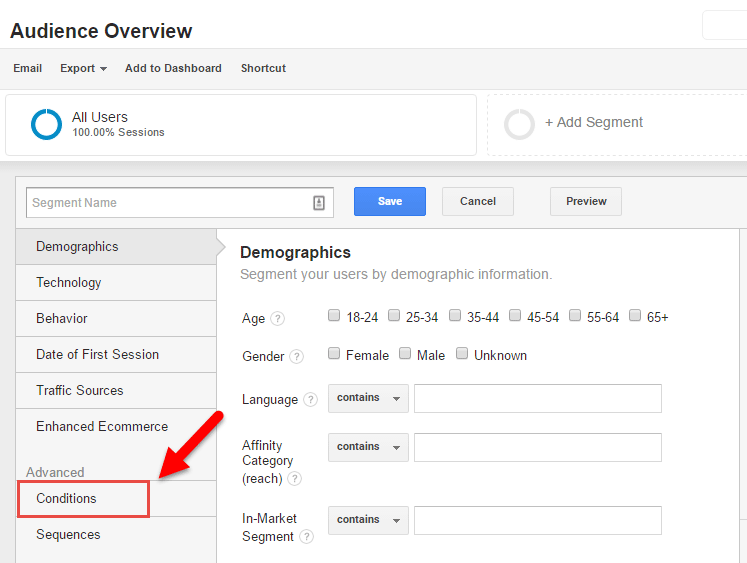
In the menu that appears, click on Conditions which appears in the Advanced section
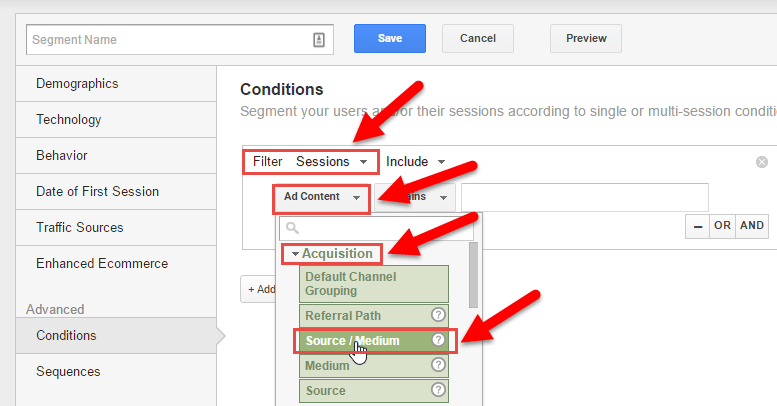
Make sure the top box shows Filter Sessions. Then select the dropdown box (Mine shows Ad Content as the default, yours may show something else). Choose Acquisition, then Source / Medium
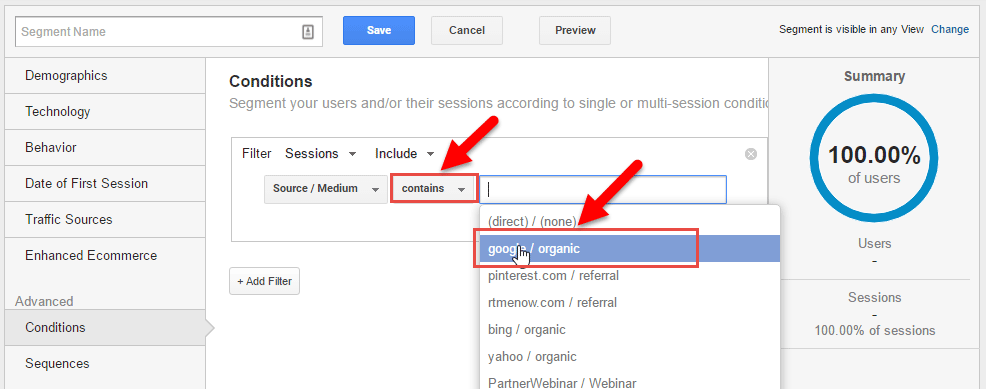
Choose contains in the middle box, then click in the right box, which will show a range of options. Choose google / organic (Hint, the items shown in that list include many of your top referral sources. You may want to create segments for those items too!)
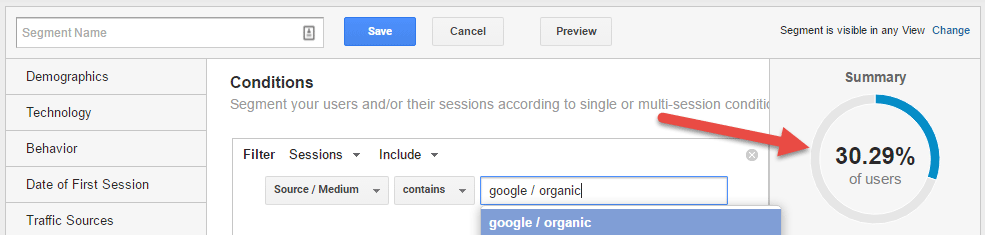
Once you click to add google / organic, you’ll see the graph on the right side of your screen change to show you the percentage of your traffic that comes from that source.
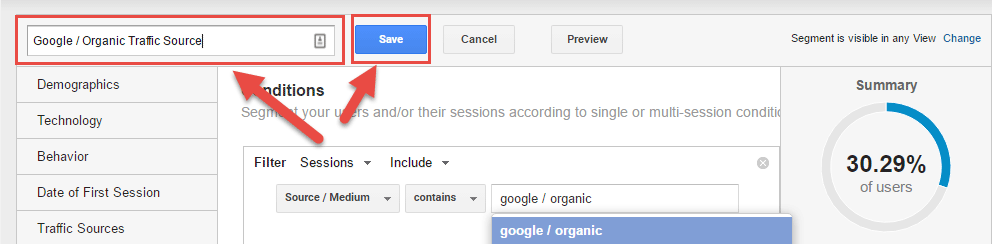
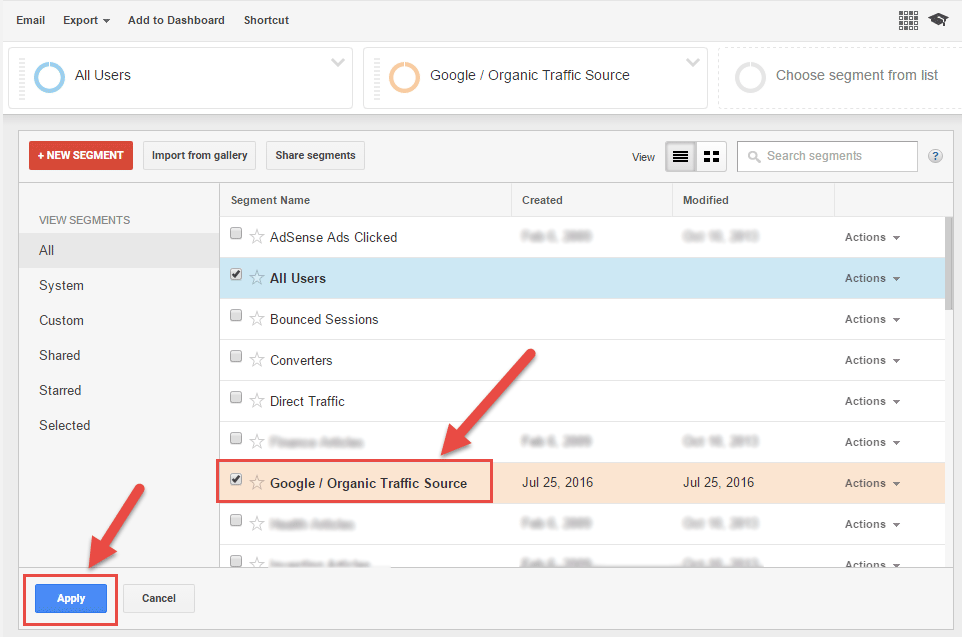
Finally, jump up to the Segment Name box, assign your segment a memorable name, and click Save
Congratulations! Now you can choose that segment in virtually any report to see how it compares to the other traffic being measured in that report. Plus, you know how to create segments for other traffic sources!
Step 2: Analyze Your Traffic Using The Google / Organic Segment
Now, let’s look at how to use this segment to answer the question “was my change in traffic due to a change in Google?”
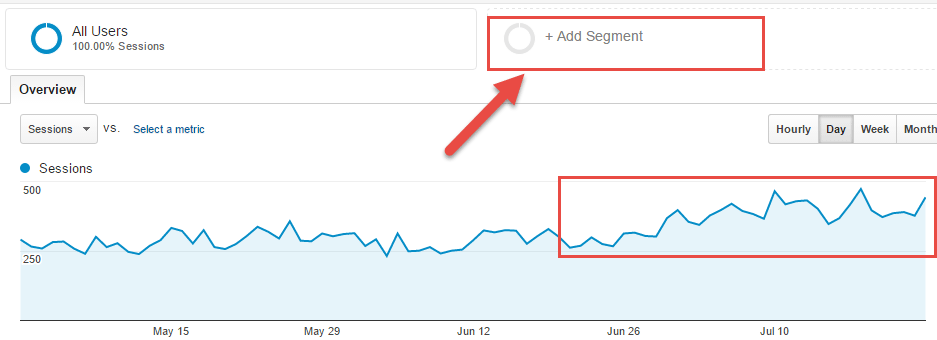
Here’s a site that’s enjoyed a nice, though not huge, increase in traffic.
How much of that is due to Google? Simply click the + Add Segment button (as shown in the picture above,) select our Google / Organic Traffic Source, and don’t forget to click the Apply button…
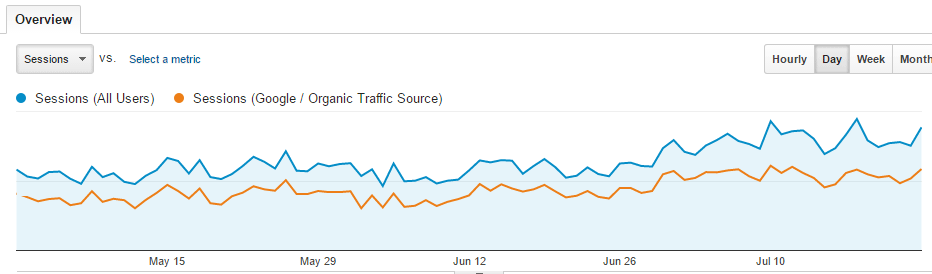
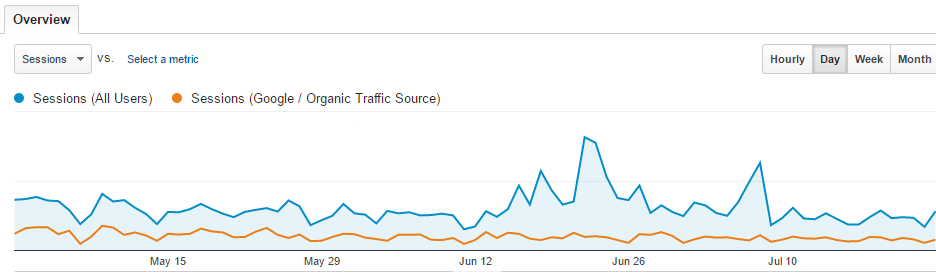
And this is what appears:
It’s pretty clear that Google Traffic is the major driver of most of the traffic changes during this period, though the last two weeks or so have something else that’s adding a small bit of additional traffic (we’ll discuss more on how to find out what’s creating that additional traffic in a future post.)
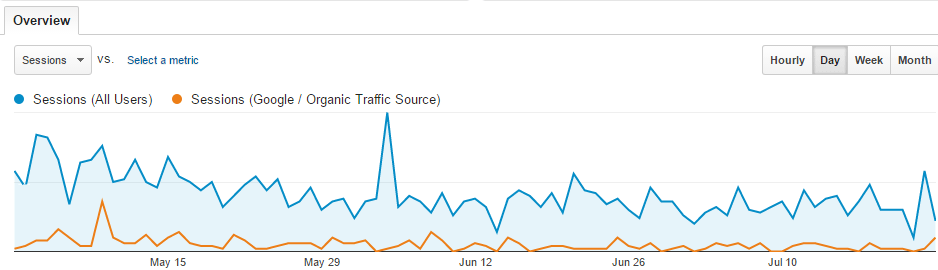
Here’s a different site where you can see that Google has almost nothing to do with the reduction in traffic:
As with this one
Of course, answering the bigger question of whether Google changes are affecting overall traffic to a site are best viewed over a longer period of time and with less noise. So, in this case I’ve increased the time period to a year (be careful with this view: if your site has seasonal / holiday swings, you will need to take that into account) and changing from a daily view to a weekly view.
Doing so, tells me that in this site’s case, it has basically been unaffected by recent Google changes, but I definitely need to do additional research to figure out what’s causing the overall traffic to decrease over the past 6 months while the Google traffic decreased by a lesser amount.
So that you know, you can set up 1,000 different segments (plus another 200 for more specific use cases) so don’t be stingy in setting up lots of different views. Just make sure that you choose views that contain lots of data – you don’t want to be making decisions based on small groups of people, because that data probably isn’t projectable to large amounts of data.
And keep in mind that you can use segments to look at everything from overall traffic, to traffic to individual pages, to goal achievement, to e-commerce results, so segments are among the most useful and versatile tools in your Google Analytics toolbox!
By the way, one of the coolest things about Google Analytics is that by using segments and setting a specific timeframe, you can quickly and easily scroll through all your sites, choosing each one, and seeing the same chart (using the same timeframe and segments) for each site you run, allowing you to easily identify the ones that need additional attention.
All of the graphs in Part 2 above (except the last one) were made by choosing a time frame and turning on the Google / Organic Traffic Segment, then simply selecting different sites from my portfolio, which then displayed the same graph using each site’s data to make my analysis easier.
Finally, I’d better tell you how to turn off the segment view, because it’s not intuitive. To do so, simply click on the second segment box (in this case Google / Organic Traffic Source) then drop down and click off the checked box in front of Google / Organic Traffic Source, then click the blue Save button, which will make it disappear from your graphs. The information is still there, but it’s now only visible when you repeat the process, clicking the box back on again.
[thrive_text_block color=”blue” headline=”Action Item”] Jump into your Analytics account right now, and set up a Google / Organic Traffic segment following the instructions in Step 1. Then use it to look at your traffic over the last 2 years. How much of your traffic variability has come from Google versus other sources? We’ll discuss more about how to identify other causes and what to do with that data in future posts.[/thrive_text_block]
Oh, and one final reminder: as you seek to get more traffic from organic Google searches, don’t try to game the system or pay attention to those who claim they’ve identified “loopholes” in Google’s algorithm. That’s a road to disaster. Instead, when you focus on creating content that people love, Google will reward you too!
That’s the secret to getting great rankings in Google – create great content that people love, share, link to, and engage with, and you’ll quickly find your content’s search engine rankings improving and bringing you more traffic over and over again, for years!
What did you discover? What else do you plan to do with the segment tool in Google Analytics? Share your feedback by leaving a comment below. And don’t forget to Share, Like, Tweet, +1 and Pin this post!